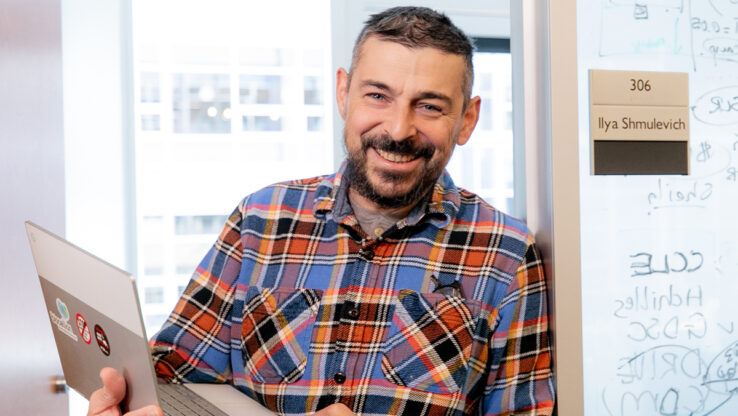
ISB Q&A: David Gibbs, Research Scientist
 shmulevich.isbscience.org/2017/03/20/isb-qa-david-gibbs-research-scientist/
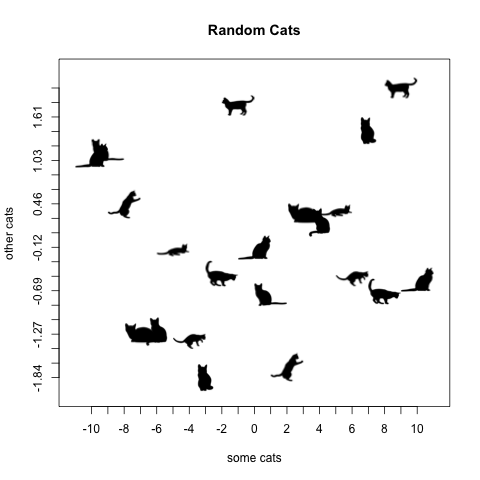
You have to have fun. ISB founder Dr. Lee Hood always reminds staff that it’s important to do great work, and it’s also important to have fun. In that spirit, we feature CatterPlots, a “silly idea” that brought a smile to many scientists.
Q: What is CatterPlots and how is it used?
David Gibbs: The R programming environment is organized around a large collection of software packages. Many packages are for statistical analysis and many others are for visualizing data. My contribution, CatterPlots, is an R package which solved the vital problem of visualizing data through the use of cat shaped points. In the past, statisticians were almost literally forced to use only regular shapes such as circles and squares. But through the use of CatterPlots, new analytical realms have opened up, allowing for untold numbers of discoveries to be made. I hope I’m not suffering from an acute case of hubris. Actually, a researcher from UC Davis said that it would be used in their “Cat (gut?) Microbiome” work. I wish them luck. I imagine that involves some difficult lab work.
Q: What inspired you to create CatterPlots?
DG: First of all, I like silly ideas and things. I’ve always been inspired by the “101 Unuseless Japanese Inventions” book. CatterPlots was one of those things that just pops into your head while walking around, and I instantly knew it was an idea that I should hold onto. I guess it comes from making lots of (s)catter plots and a fascination with “internet culture” which seems to be highly associated with cats (p-value < 0.05).
Q: What does it feel like to be “internet famous” for CatterPlots?
DG: It was a very mildly exciting 24 hours. Unfortunately, I was not able to cut in line at coffee shops, or get free donuts. Actually, I released it as an April Fool’s joke in 2016. Then, around Valentine’s 2017, a highly influential Twitter person tweeted about it, and it picked up really fast. So, after all that time, from the initial release to when it received some attention, it was quite a surprise. On Twitter, it was pretty popular, but in “real world terms,” I received approximately two or three emails. I guess I was not exactly overwhelmed in my daily life. That lasted for about a day before everyone’s collective attention floated over to some other topic.
#Rstats pkg CatterPlots, just in case you needed to make a scatterplot with cat-shaped points. https://t.co/zs0No5JZee pic.twitter.com/HRibLSP5uE
— Stephen Turner (@genetics_blog) February 14, 2017
Q: What’s next for CatterPlots?
DG: Well, I rarely have time for “fun” programming, but I would love to add a rainbow-Nyan-cat plot. That would be awesome. CatterPlots is also really difficult to use, but I can’t decide if that’s a feature or a bug.